Fintech / Data Viz · 2026
fin-pocket
A Python library for technical analysis of stock charts
Published: · Updated:
- Role
- Solo development of the Python library
- Stack
- Python, yfinance, pandas, plotly, numpy
- Year
- 2026
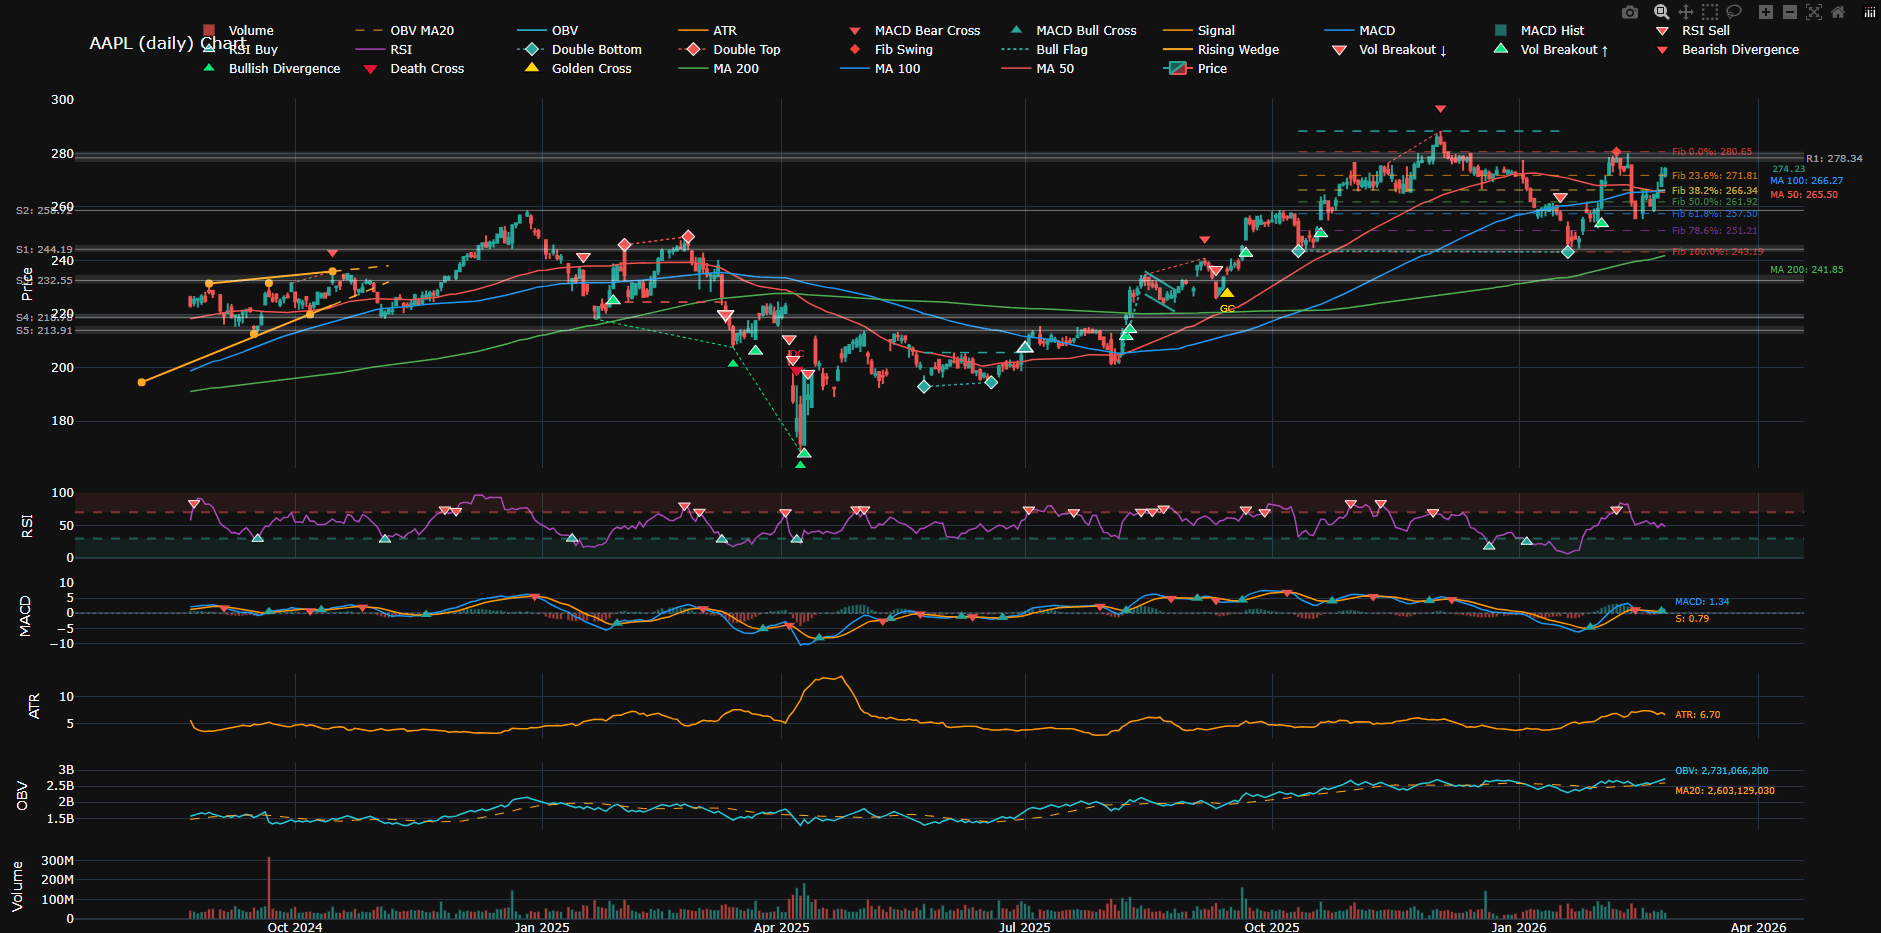
fin-pocket is a lightweight Python library for technical analysis and automated pattern recognition on stock charts. It pulls historical data from Yahoo Finance and renders interactive charts with a set of technical indicators.
The challenge
Traders and developers needed an accessible tool that could apply multiple technical indicators at once and recognize common chart patterns, without turning to heavy paid platforms.
The solution
- ▸Moving averages (MA 50/100/200) with Golden Cross and Death Cross detection
- ▸RSI with overbought/oversold zones and divergence detection
- ▸Support/resistance levels from pivots and volume breakout detection
- ▸Pattern recognition: wedge, flag, pennant, double top/bottom
- ▸Bollinger Bands, MACD, ATR, OBV and Fibonacci retracement levels
- ▸A chart screenshot can be sent straight to a chatbot (ChatGPT, Claude) for signal analysis
How it works
fin-pocket is a command-line tool and a Python package published on PyPI (pip install fin-pocket). A single command like fin-pocket AAPL downloads historical prices from Yahoo Finance, calculates the enabled signals and opens an interactive Plotly chart in the browser; with --output the chart is saved as a standalone HTML file that can be shared or archived.
- ▸Daily or hourly timeframe via --timeframe
- ▸Every signal can be switched off individually (--no-rsi, --no-wedge and so on); Bollinger Bands are opt-in with --bb
- ▸MACD (12, 26, 9), ATR (14) and OBV with a 20-period moving average on separate panels under the price chart
- ▸Fibonacci retracement levels from 23.6% to 78.6%, calculated from the last major price swing
Engineering
Edge cases in signal calculations and chart handling are covered by tests, including guards against division by zero on flat price series. CI runs on GitHub Actions with coverage reported to Codecov, versions are derived from git tags with setuptools-scm, and releases are published to PyPI automatically.
The result
Interactive Plotly charts make it easy to review signals from several indicators at once, and the screenshot-to-chatbot workflow makes quick AI analysis possible without a separate integration.
Mentions & sources